DBConvert Streams Dashboard and UI Guide
Dashboard Overview
The DBConvert Streams dashboard provides a centralized interface for managing your data streams and monitoring system status. The dashboard is divided into three main sections:
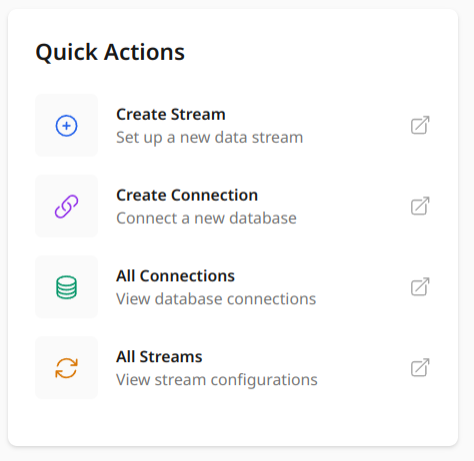
Quick Actions
- Create Stream: Set up a new data stream
- Create Connection: Connect a new database
- All Connections: View and manage database connections
- All Streams: Access stream configurations
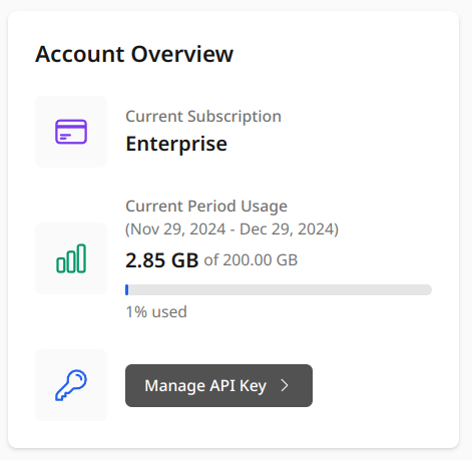
Account Overview
- Current subscription tier
- Current period usage with graphical representation
- Data transfer quota monitoring
- API key management
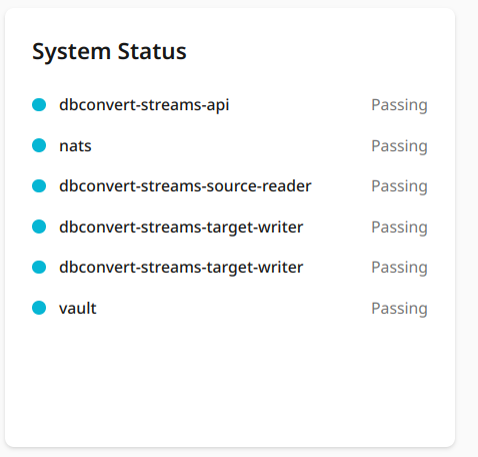
System Status
Live monitoring of key system components:
- stream-api
- stream-reader
- stream-writer
- nats
- vault
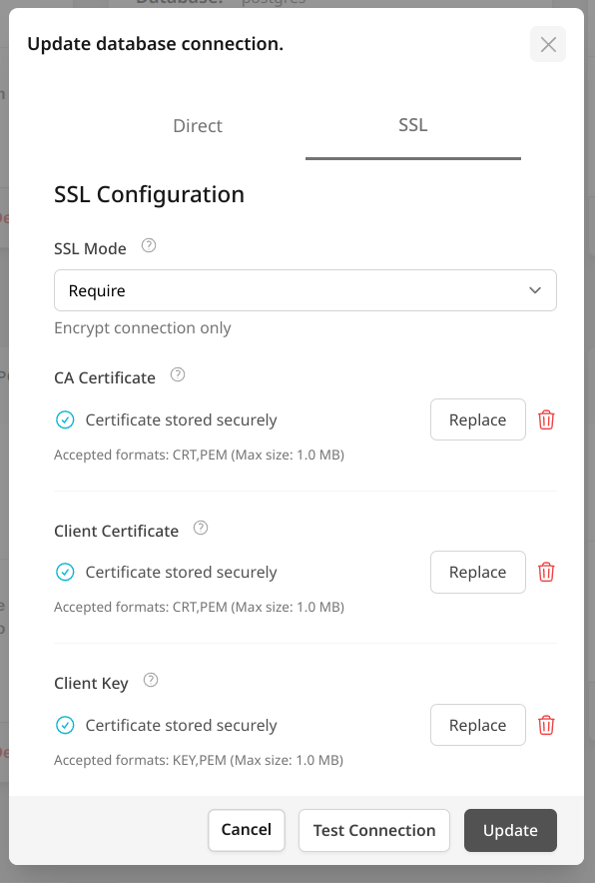
Creating and Managing Connections
Connection Management Interface
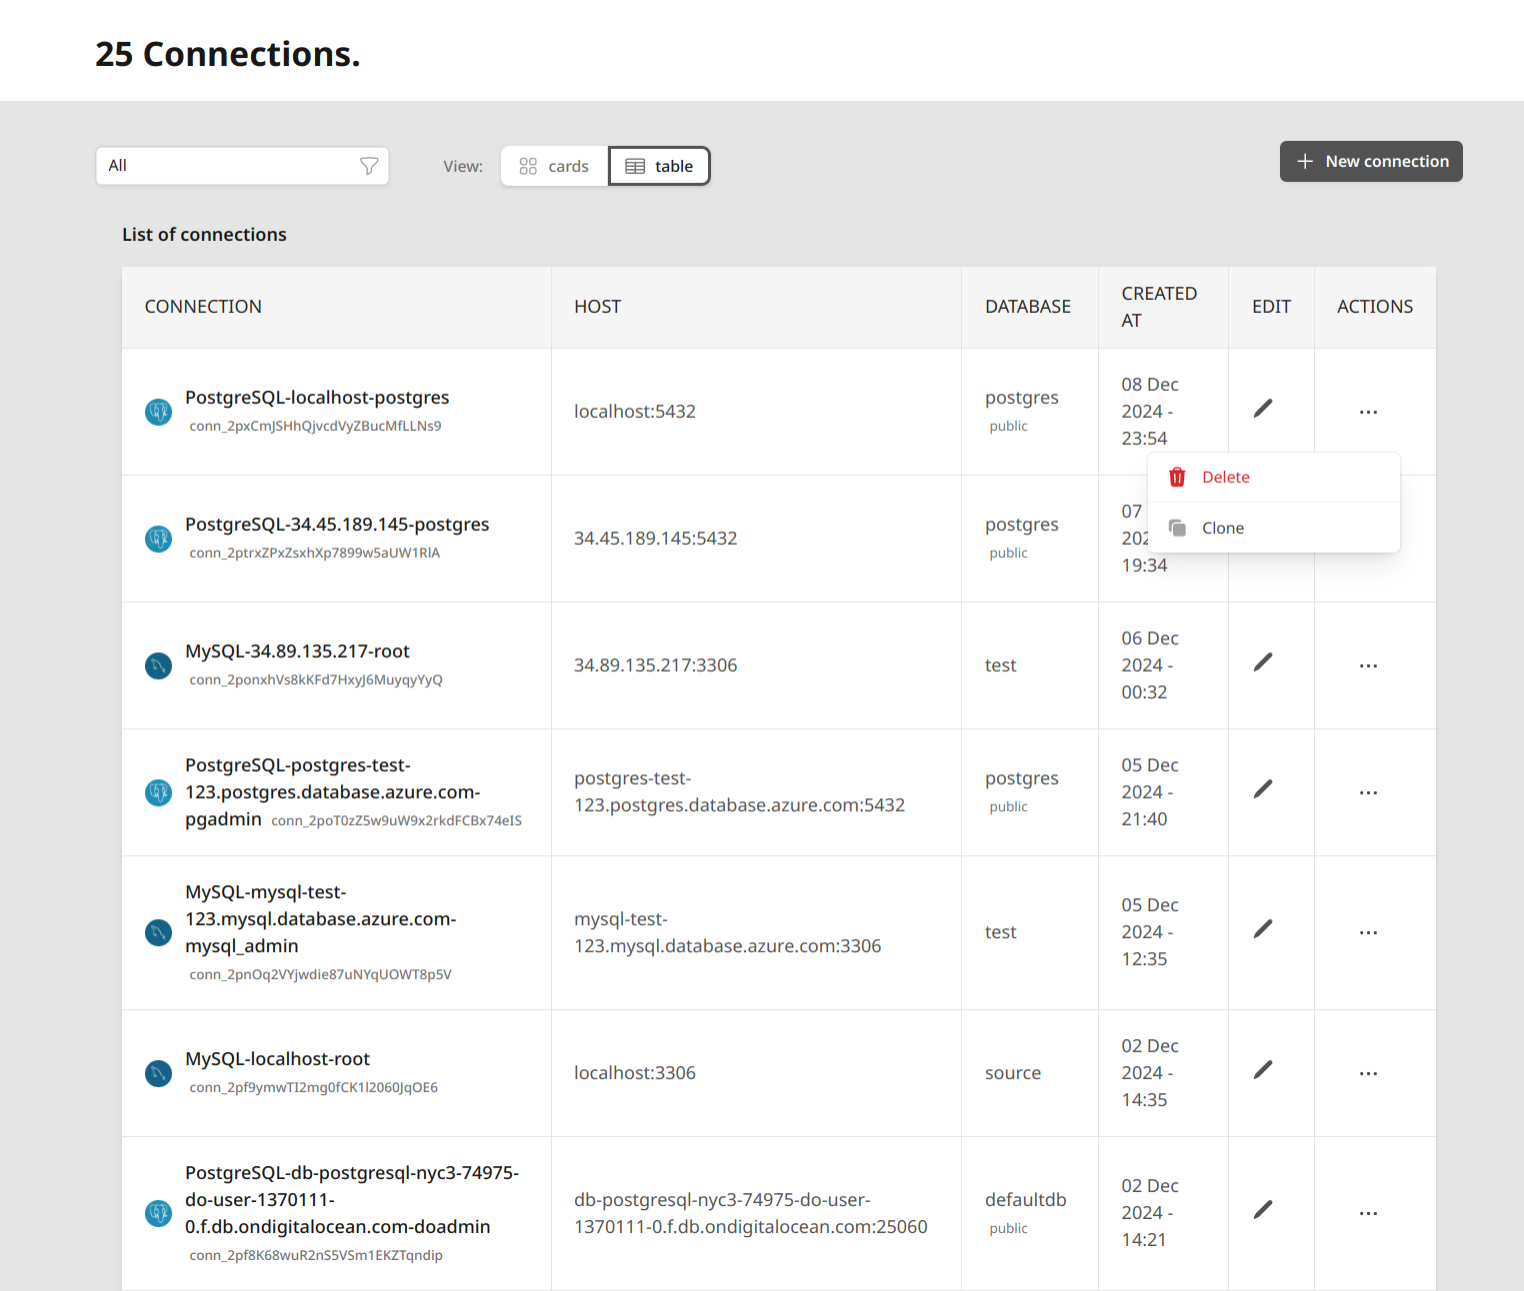
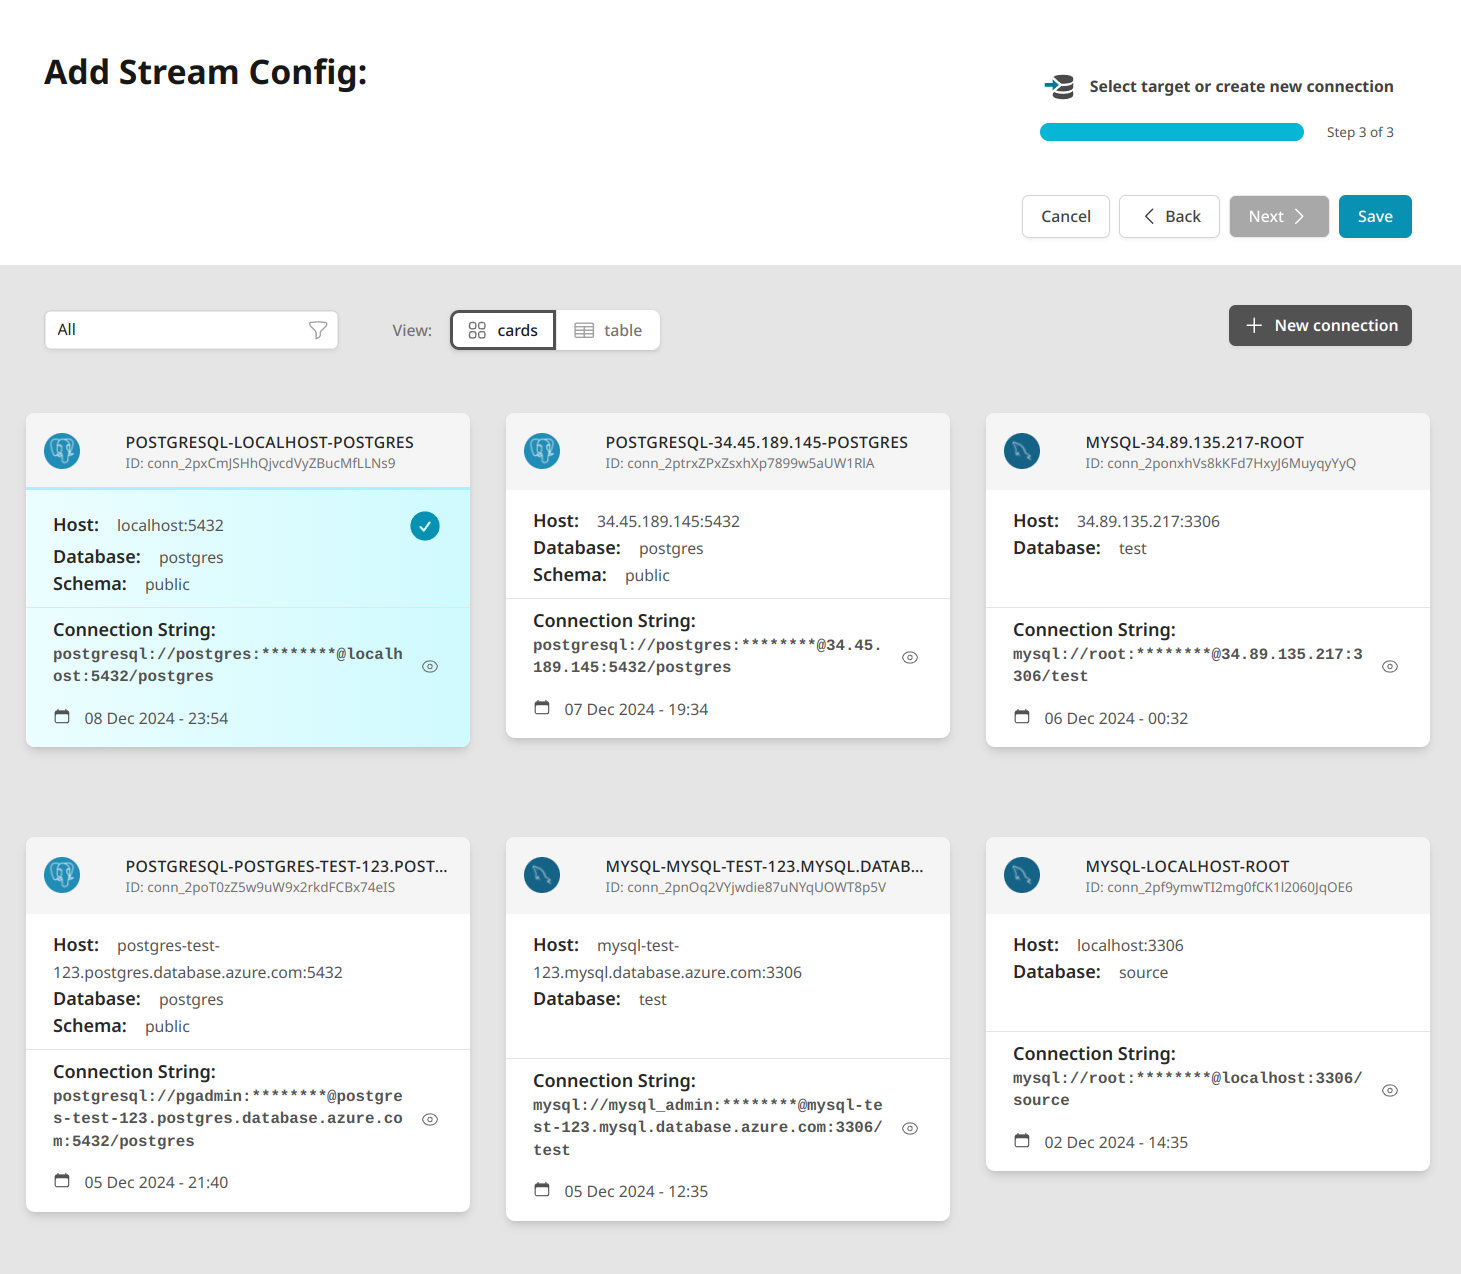
The Connections page provides a comprehensive view of all your database connections. You can view connections in either card or table layout using the view toggle button. The interface header shows:
- Total number of connections
- Filter dropdown (default: "All")
- View toggle (cards/table)
- "New connection" button
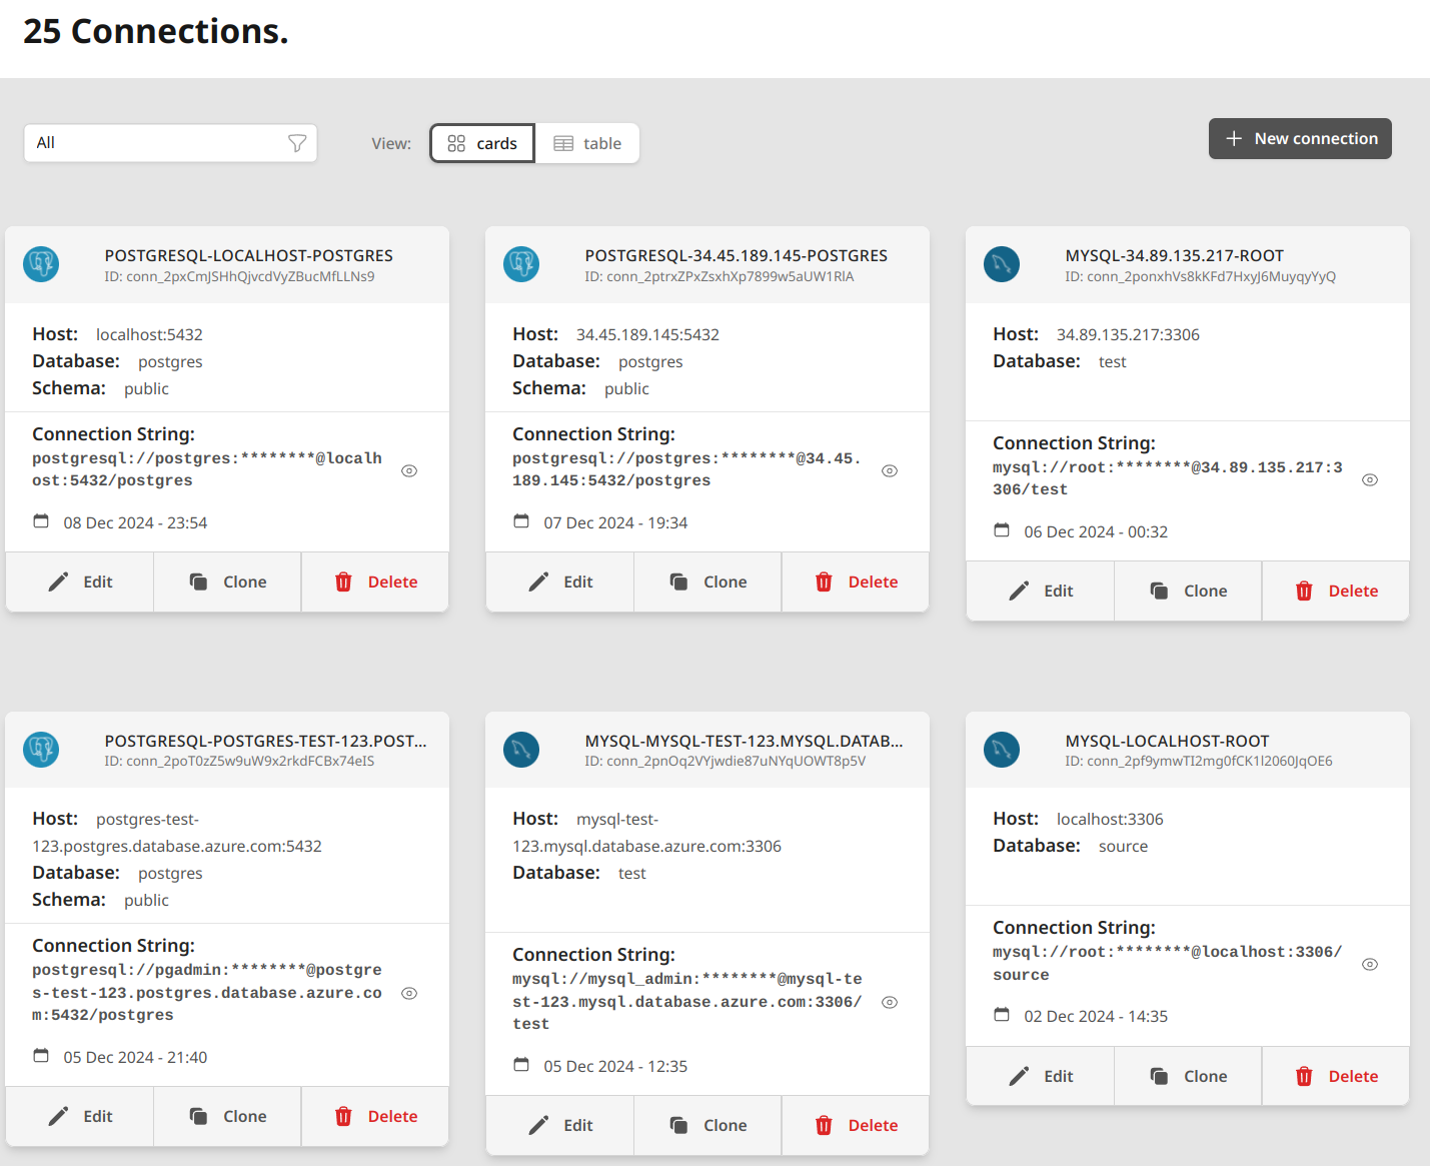
Connection Information
Each connection displays the following information, regardless of view type:
Basic Information
- Database type icon (MySQL/PostgreSQL)
- Connection name
- Unique connection ID
Connection Details
- Host: Server address and port
- Database name
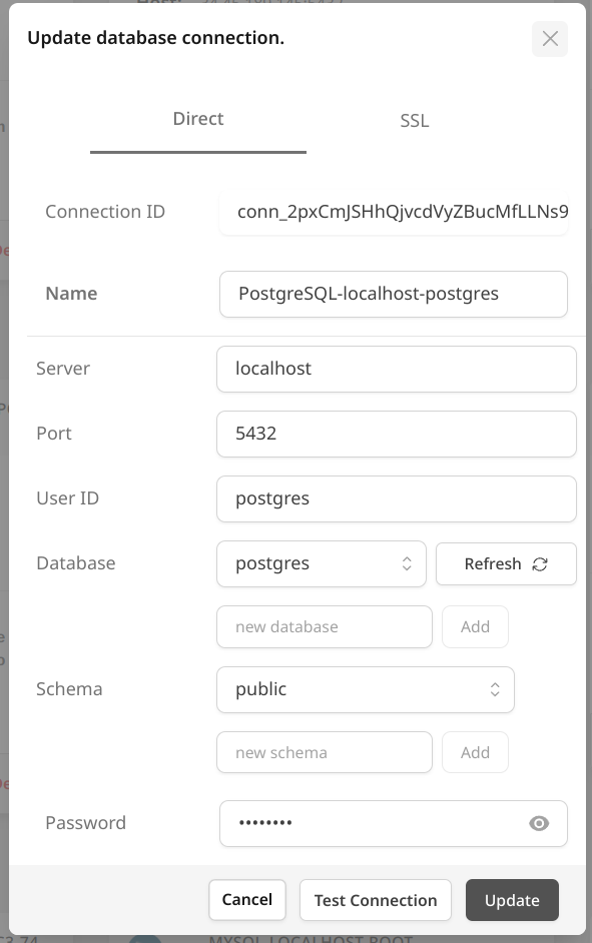
- Schema (for PostgreSQL connections)
- Connection string (securely masked)
- Creation timestamp
Available Actions
For each connection, you can:
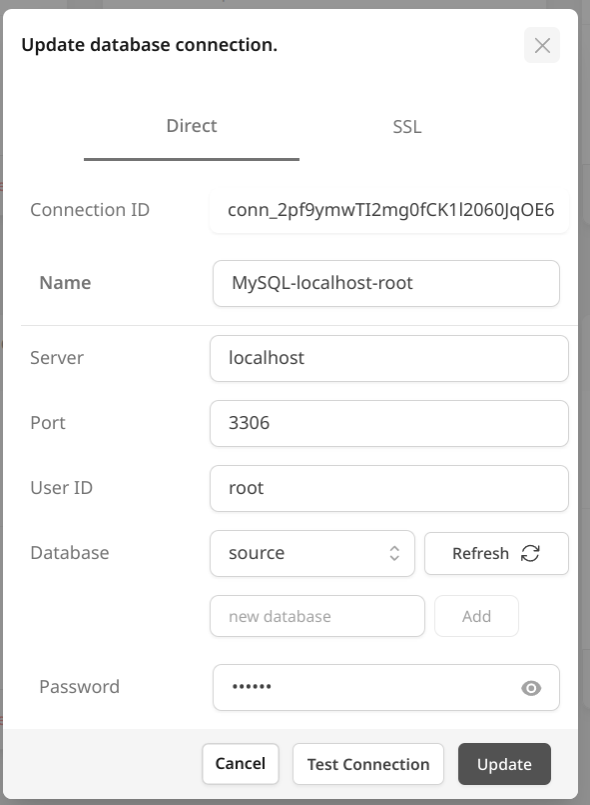
- Edit: Modify connection settings
- Clone: Create a duplicate connection
- Delete: Remove the connection (with confirmation)
You can perform these actions through either view type, with the table view providing a more compact representation and the card view offering a more detailed layout.
Stream Configuration and Management
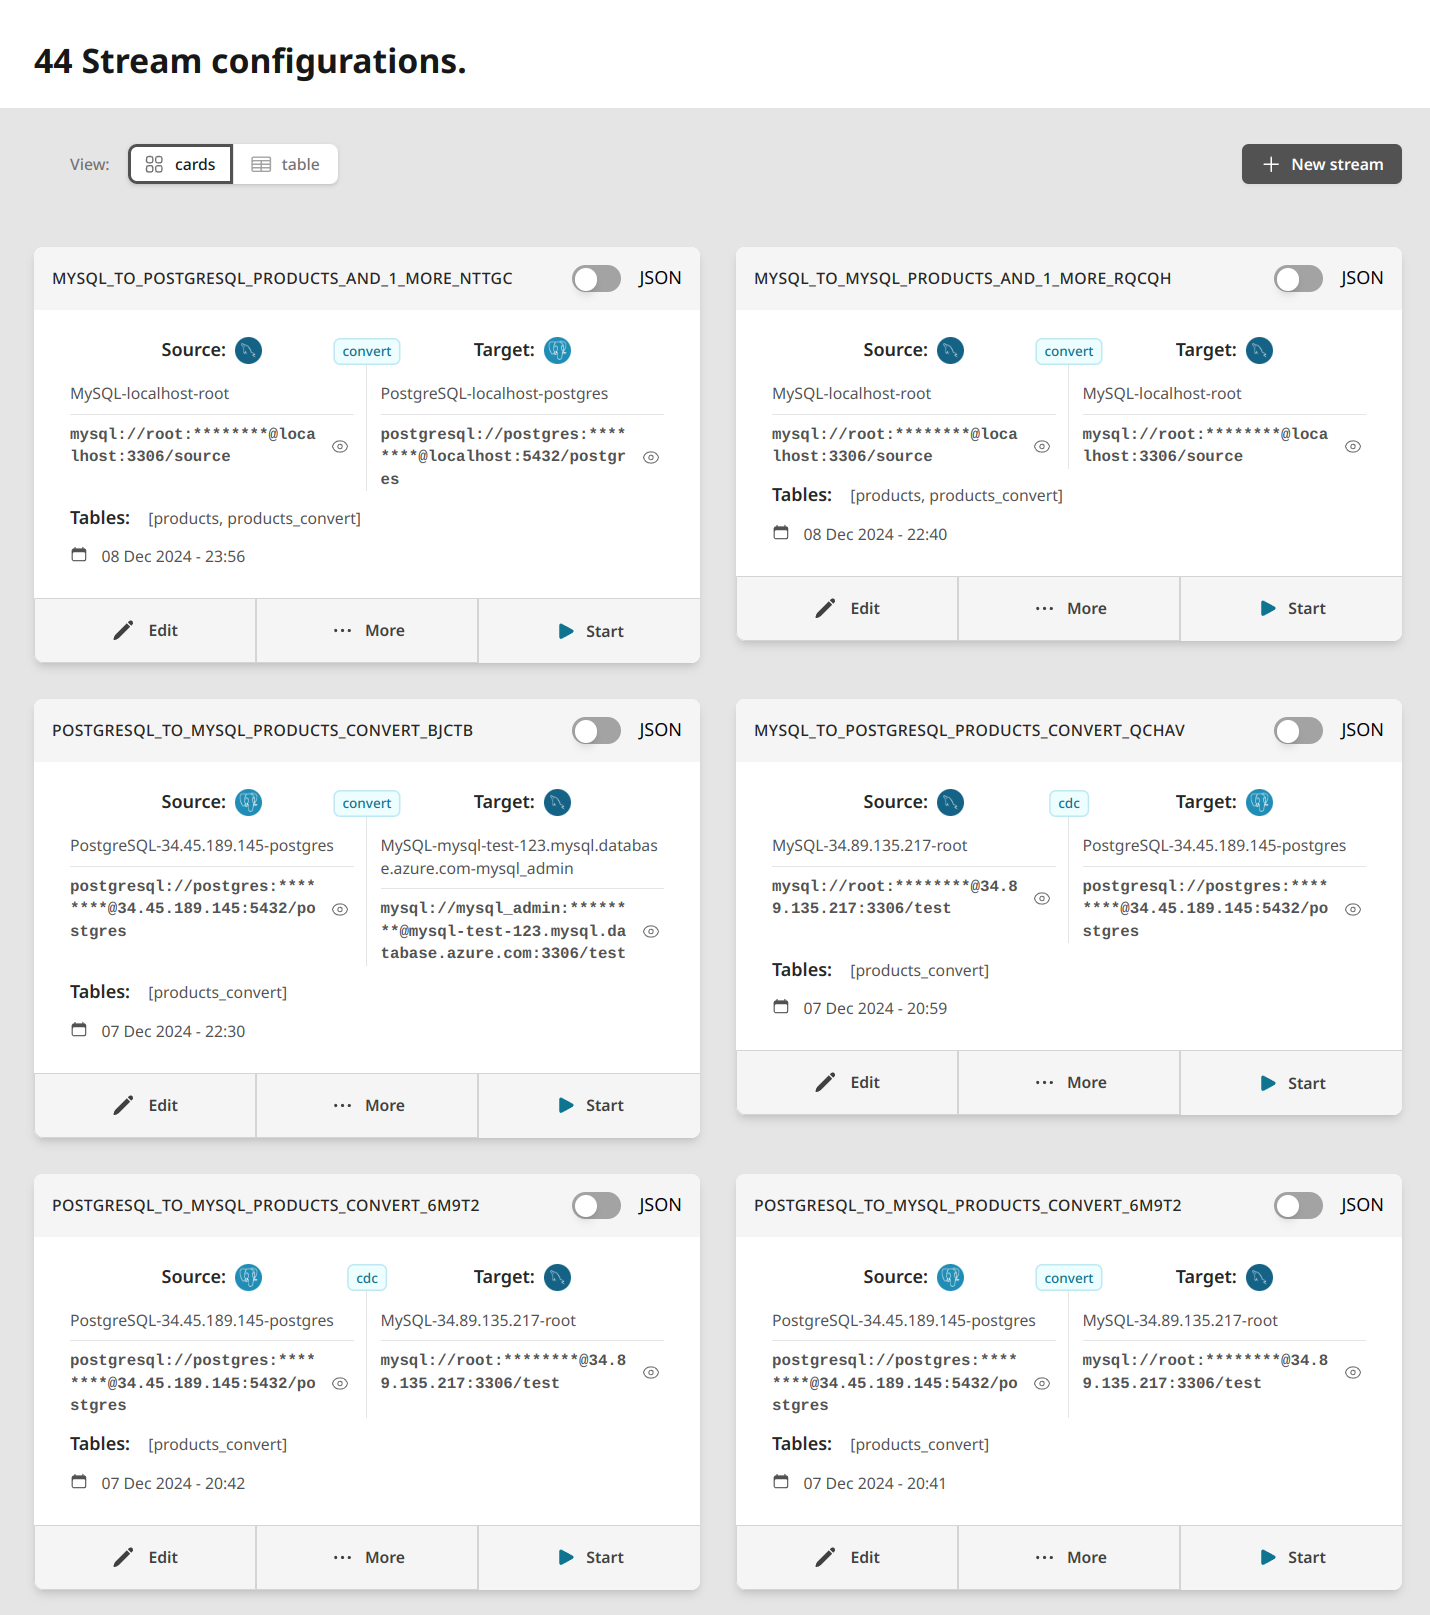
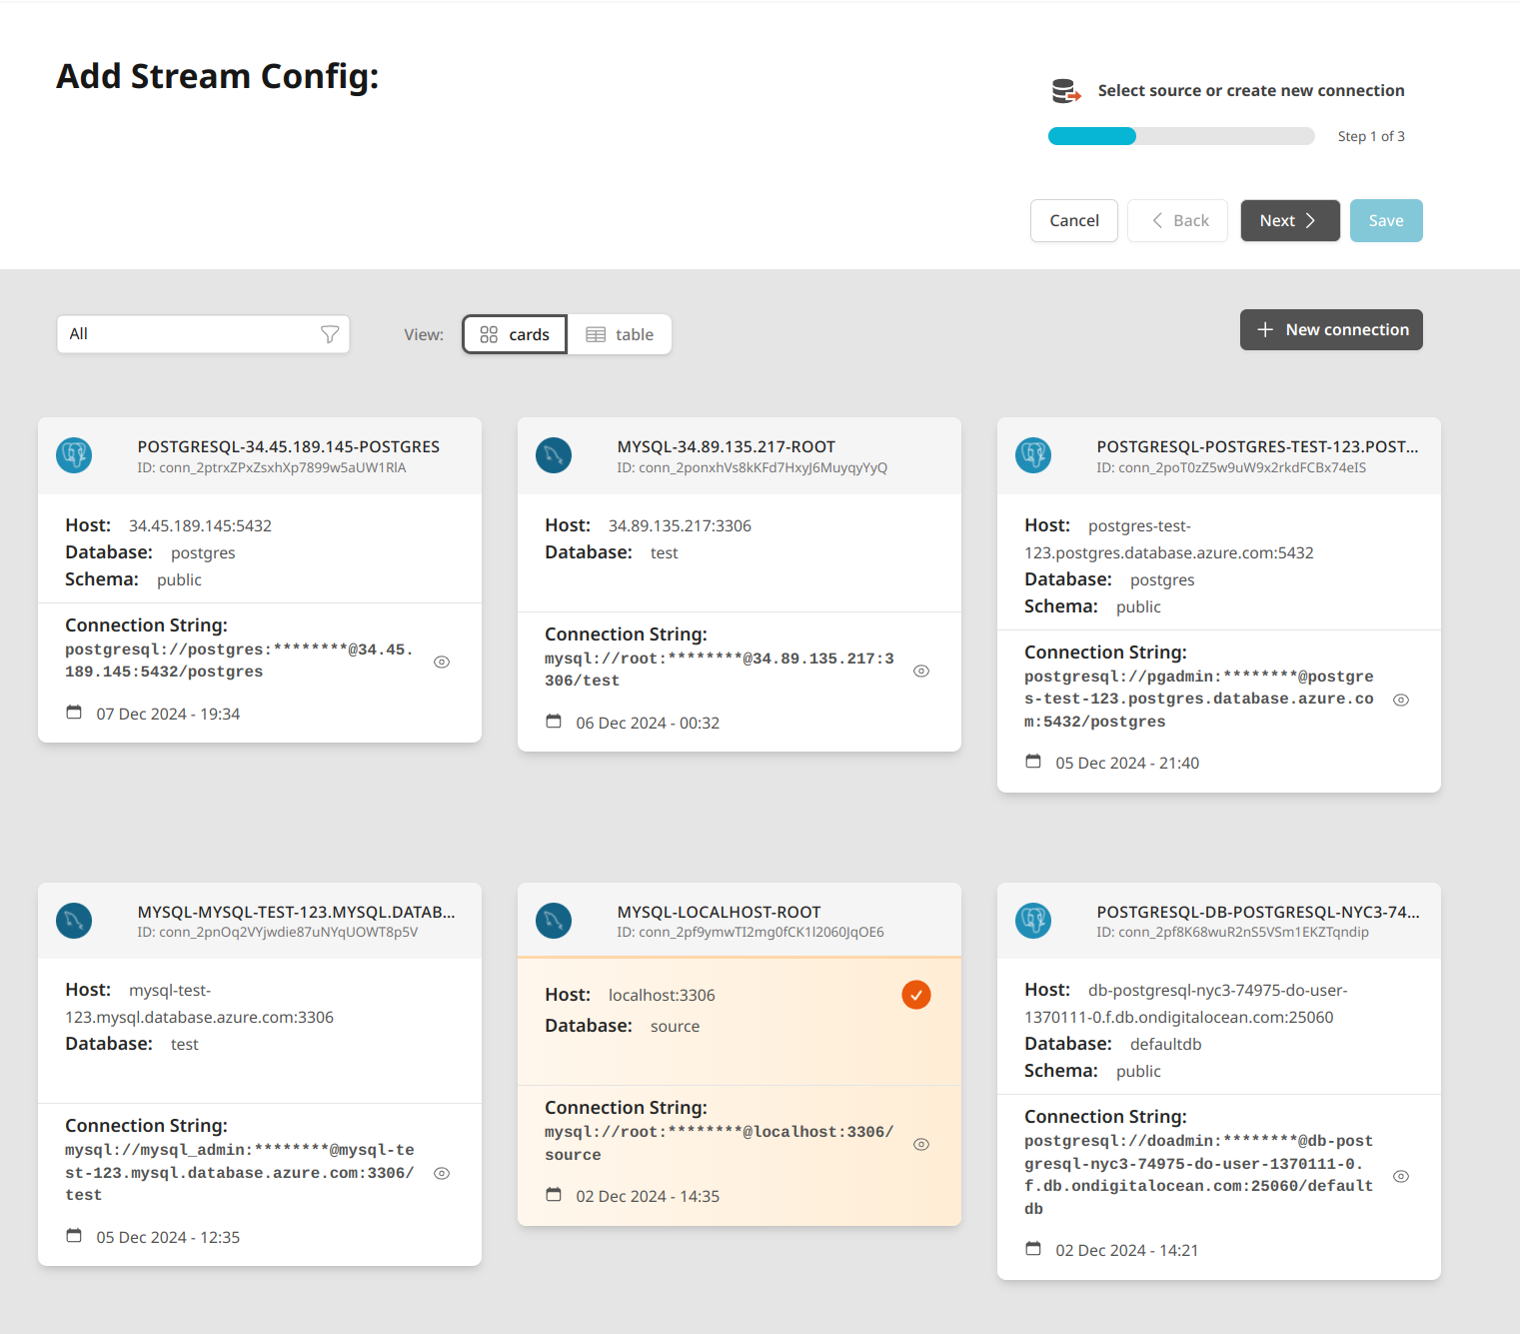
Stream Creation Process
- Select Source
- Choose an existing connection from your configured sources
- Or create a new source connection
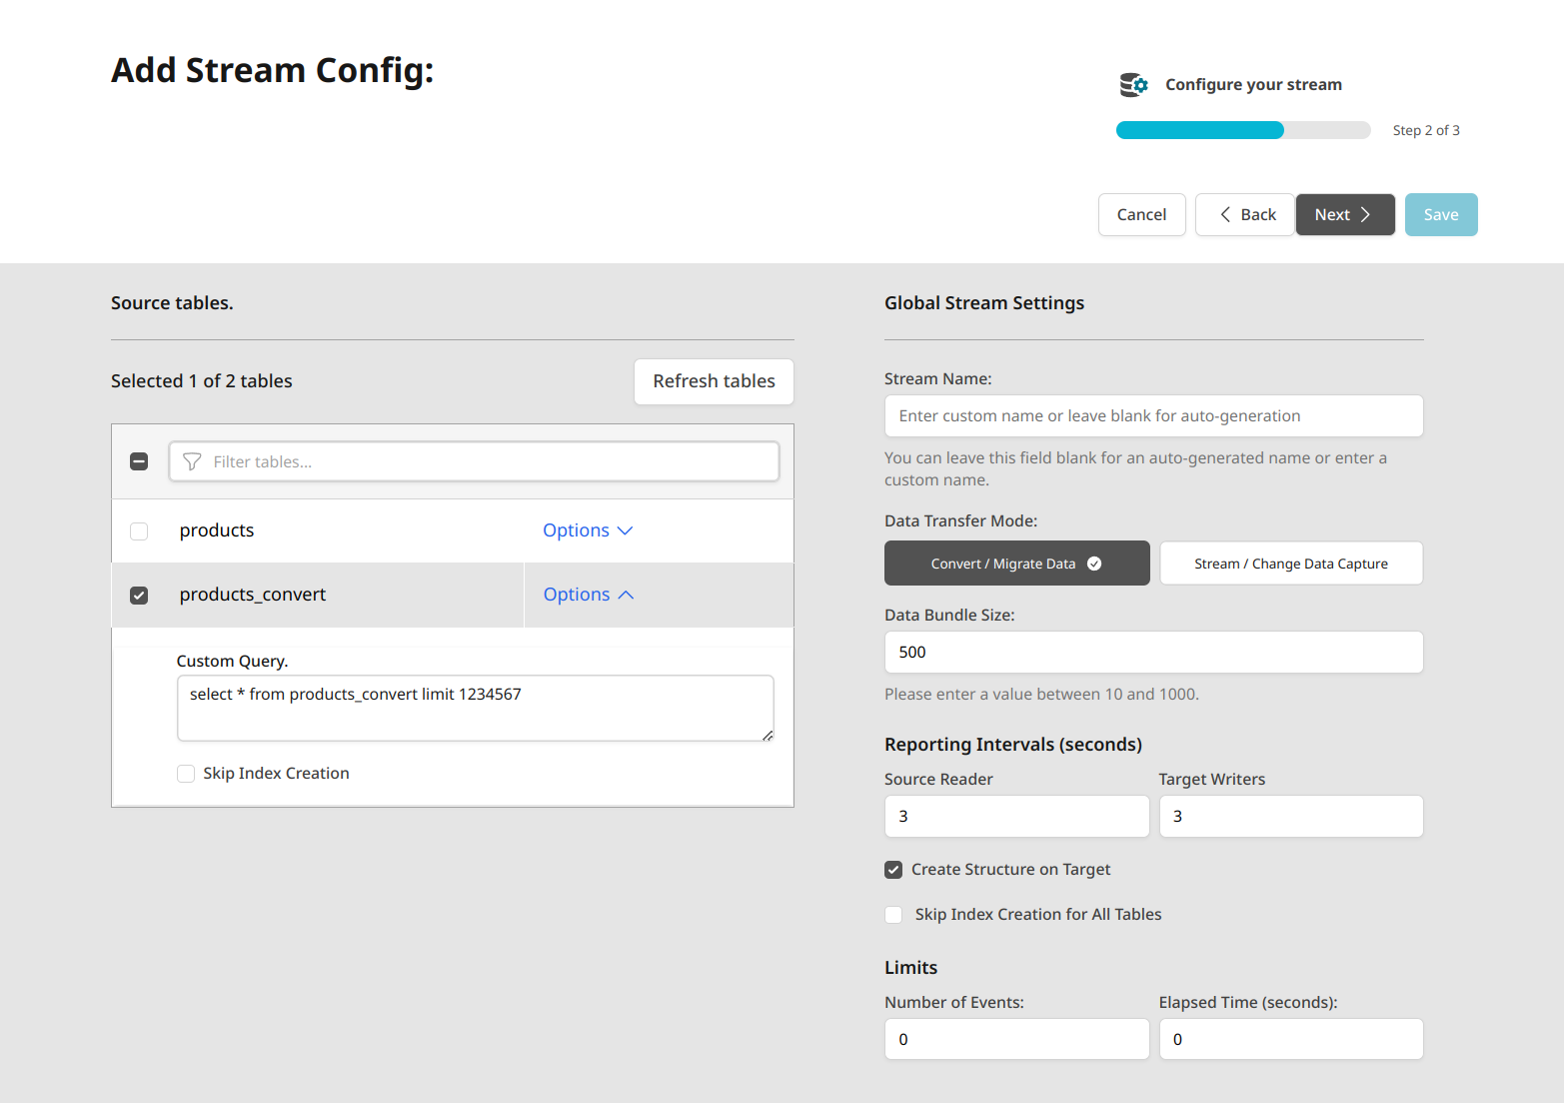
- Configure Stream Settings
The stream configuration page is divided into two main sections:
Source Tables
- Table selection with checkboxes
- Filter field to search tables
- Table options including:
- Custom Query capability
- Skip Index Creation option
- Refresh tables button
- Shows count of selected tables
Global Stream Settings
- Stream Name (optional, auto-generated if left blank)
- Data Transfer Mode:
- Convert / Migrate Data
- Stream / Change Data Capture
- Data Bundle Size (value between 10 and 1000)
- Reporting Intervals (in seconds)
- Source Reader interval
- Target Writers interval
- Structure Options:
- Create Structure on Target toggle
- Skip Index Creation for All Tables option
- Limits:
- Number of Events: Stop stream after processing specified number of events (0 for unlimited)
- Elapsed Time in seconds: Stop stream after specified duration (0 for unlimited) These limits can be set for both conversion and CDC modes, though they are particularly valuable in CDC mode for controlling long-running replication processes.
- Select Target
- Choose an existing target connection
- Or create a new target connection
- Click save button
- Start and Monitor
- Initialize the stream
- Monitor progress through the visual interface
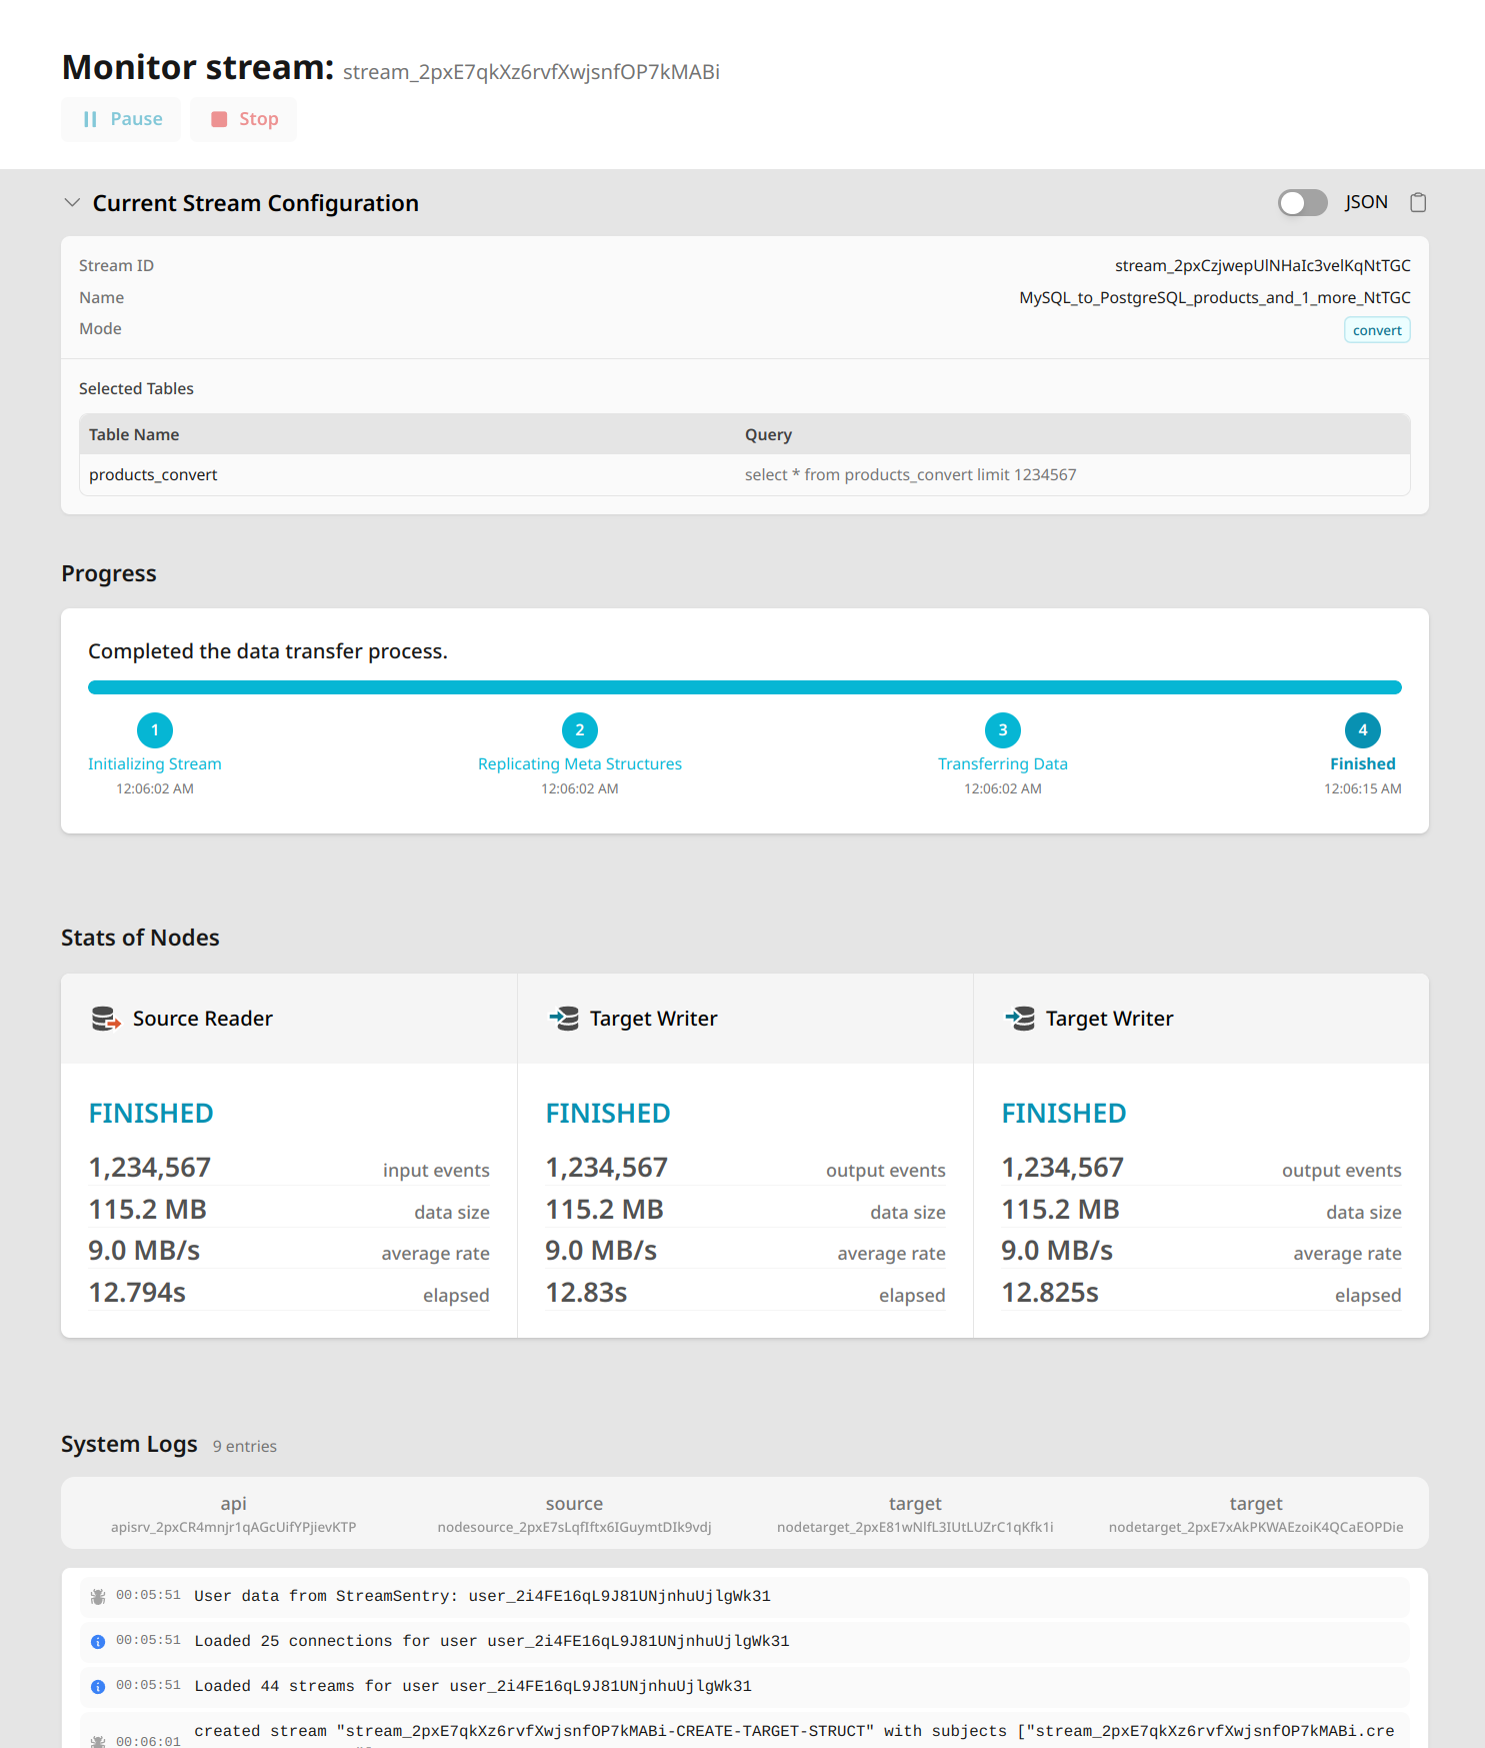
Stream Monitoring
The stream monitoring interface provides real-time insights into your data transfer:
Progress Tracking
Visual progress indicator showing four key stages:
- Initializing Stream
- Replicating Meta Structures
- Transferring Data
- Finished
Stats of Nodes
Detailed metrics for each component:
Source Reader
- Number of input events
- Data size
- Average transfer rate
Target Writer
- Number of output events
- Data size
- Average transfer rate
System Logs
The System Logs panel displays operational messages from different components of the system:
- Messages from api, source, and target components
- Running status with event counts and data size
- Progress updates at regular intervals showing processed events and data size
- Processing completion confirmation
- Final statistics including total events, size, average rate and elapsed time
Stream Controls
- Start: Begin data transfer
- Pause: Temporarily halt transfer
- Stop: End transfer process
- JSON view toggle: View technical configuration